
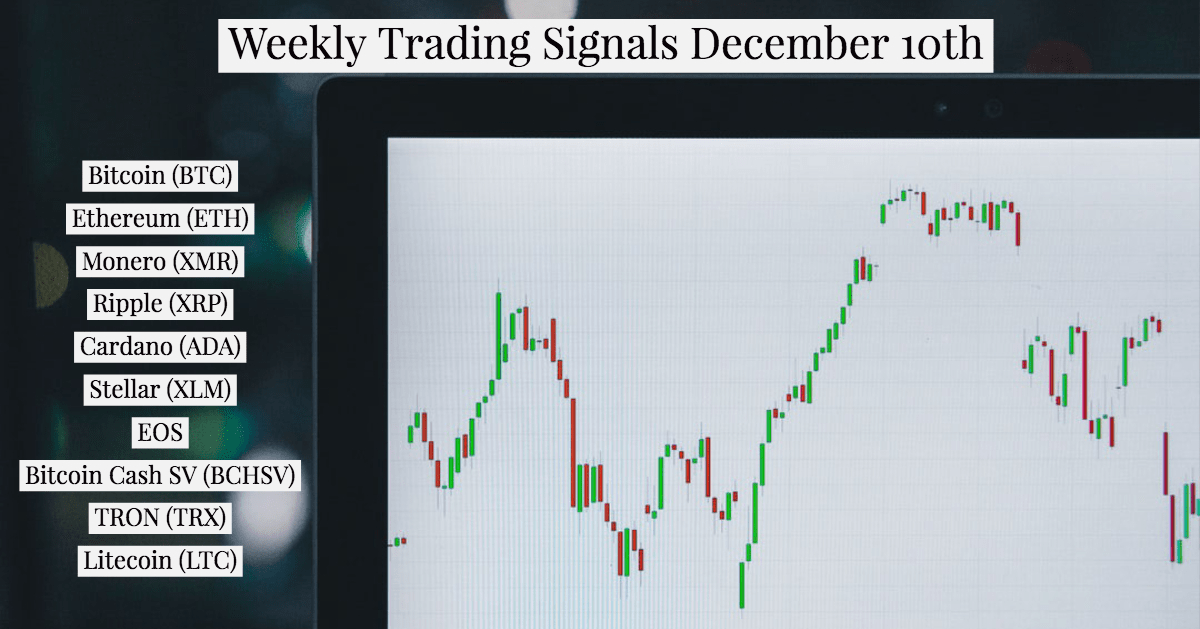
Bitcoin (BTC), Ethereum (ETH), Monero (XMR), Ripple (XRP), Cardano (ADA), Stellar (XLM), EOS, Bitcoin Cash SV (BCHSV), TRON (TRX), Litecoin (LTC): Weekly trading signals for DECEMBER 10th
BTC/USD
Dominant trend: Bearish
Supply zone: $6400, $7200, $8000
Demand zone: $2500, $2000, $1500
The market remains under the control of the bears on the long-term outlook. Having achieved the predicted target last week at $3377 on 7th December and a further drop to $3277 in the demand area, it seems that the bitcoin trader bears are able to have a brief rest. Exhaustion at the demand area denoted by wicks coupled with hammer signalled the bulls gradual return.
BTC/USD was up at $3800 on 8th December, but a further upward movement was rejected around the 10-EMA. The cryptocurrency provides a down-trending market scenario with the formation of lower highs and lower lows.
With the price below the two EMAs that are fanned apart which suggest strength in the context of the trend and in this case the downtrend, BTCUSD may be set for a new lower low as the bears’ pressure becomes much stronger.
ETH/USD
Dominant trend: Bearish
Supply zones: $200, $220, $240
Demand zones: $50, $40, $30
The bears’ pressure was sustained in the past week as Ethereum went further down to $83.00 in the demand area on 7th December closing the week lower than the previous at $111.52. Rejection to further downward price movement was obvious as the bulls return this was signalled by the two hammers formation a strong indication of trend reversal.
$102.50 in the supply area was retested as the new week began on 9th December.
This flag formed by the bullish pressure was necessary for the market correction before the downtrend continuation. With the price below the EMAs an indication of strong bears pressure, $53.93 the 261.8 fib level in the demand area may be tested in days ahead.
XMR/USD
Dominant trend: Bearish
Supply zone: $120.00, $140.00, $160.00
Demand zone: $20.00, $10.00, $05.00
The bears remain in control of XMR outlook. $43.06 in the demand area was the low of the week that started with an inverted hammer on 2nd December characterised by two bearish marubozu candles.
The new week began with a tweezer bottom formation an indication of bullish reversal which should be seen as a pullback necessary for the market correction.
The stochastic oscillator is in the oversold at 19% and price below the two EMAs that re fanned apart. It suggests that bears may stage a strong return after the brief pullback that dropped the cryptocurrency at the $23.00 bears target in the long-term.
XRP/USD
Dominant trend: Bearish
Supply zone: $0.5000, $0.5500, $0.6000
Demand zone: $0.2000, $0.1500, $0.1000
XRP/USD continues in a bearish trend on the long-term outlook. The cryptocurrency is in a nice downward channel. With each touch at the lower line setting up the bulls while a touch at the upper line returns the bears. 7th December saw the bulls entrant as price bounce off to $0.3407 in the supply area.
8th December saw the bears stage a return as XRP/USD began a downward journey to the lower line of the channel.
The stochastic oscillator at the oversold region at 17% and its signal point down coupled with and price below the two EMAs, $0.2750 in the demand area remains a target as the bears’ pressure becomes stronger in as this new trading week commences.
ADA/USD
Dominant trend: Bearish
Supply zone: $0.0600, $0.0800, $0.1000
Demand zone: $0.0100, $0.0080, $0.0060
The week ended saw ADA/USD made another new low at $0.02723 in the demand area on 7th December as the bearish momentum gradually reduces after starting at $0.04041 on 2nd December.
The bullish momentum gradually pushes price up as ADA/USD retested $0.03448 as the weekend on a bullish note has pushed.
The bears’ pressure is seen at the 10-EMAs area due to rejection in possible upward price movement; hence the bullish momentum may be sustained to the 10-EMA area before a possible bears return. $0.0200 in the demand area may be tested as the bears’ pressure becomes stronger in the long term-term.
XLM/USD
Dominant trend: Bearish
Supply zone: $0.2400, $0.2600, $0.2800
Demand zone: $0.1000, $0.0800, $0.0600
$0.1200 bears target of last week analysis was broken on 6th December with a large bearish candle. Further increased bearish momentum saw XLM/USD down to $0.1011 in the demand area.
Exhaustion denoted by wicks return the bulls. The new week opened at $0.1198 saw the coins up at $0.1294 on 9th December. The flag may be up around the 10-EMA, and further upward movement be rejected before a possible bear return.
The stochastic oscillator is 27%, and its signal points up an indication of upward momentum in price due to bullish pressure. $0.1000 is on the card in the long term.
EOS/USD
Dominant trend: Bearish
Supply zone: $5.000 $6.000, $7.000
Demand zone: $1.000, $0.5000, $0.050
EOS/USD remains in a bearish trend in its long-term outlook. The strong bearish pressure was sustained as the week ended with a drop of EOS/USD to $1.55 in the demand area. This was the second retest after the breakout of 14th November 2017.
The week opened bullish at $1.85 an indication of possible correction as the pressure becomes strong with a possible retest at $2.30 in the supply area. This is still within the 23.6 fib level a trend continuation zone before possible bears return. The EMAs remained fanned apart an indication of strength in the downtrend. $1.00 in the demand area may be tested as the momentum down south increases.
BCHSV/USD
Dominant trend: Ranging
Supply zones: $100, $120, $140
Demand zones: $40, $30, $20
BCHSV/USD enters in a range-bound market in the long-term outlook. The strong bullish pressure was sustained in the past week breaking the target at $100.00 of last week analysis on 7th December and making a further high at $112.91 in the supply area before gradually weakening.
The bears’ bearish hammer at the supply area gradually return the bears with the price down to $91.00 in the demand area. The price is around the two EMAs a reflection of the consolidation.
BCHSV/USD is in consolidation and trading between $108.84 at the upper supply area and $77.29 in the lower demand area of the range. Patience is required to allow a breakout at the upper area, or a breakdown at the lower occur before a position is taking.
TRX/USD
Dominant trend: Bearish
Supply zone: $0.0200 $0.0250, $0.0300
Demand zone: $0.100, $0.0800, $0.0600
Tron remains in a bearish trend. The week ended open as a bearish pinbar at $0.01441 on 2nd December and made a low at $0.01222 in the demand area.
The new week opened at $0.01357 and made a brief upward movement to $0.01439 in the supply area but closes as an inverted doji around the 10-EMA bears an indication of bullish rejection.
The rejection of upward price movement was at the 23.6 fib level a trend continuation zone. It suggests that the journey down south may continue. The retest and possible break of $0.01110 in the demand area is possible as the bearish momentum is sustained.
LTC/USD
Dominant trend: Bearish
Supply zone: $50.00 $60.00, $70.00
Demand zone: $15.00, $10.00, $05.00
LTC/USD continues in a downtrend in the long-term outlook with the bears controlling the market. $22.54 in the demand area attained on 7th December was the low of the week as the bear momentum was lost briefly.
$24.94 was the opening price of LTC/USD as the week began yesterday.
$27.60 in the supply area was briefly retested and the day ended as an inverted hammer an indication of bears gradual return. Price is below the two EMAs that are fanned apart an indication of strong bears pressure in the market. As the bears sustained the pressure, Litecoin may drop to $10.00 in the demand area on the long-term.
By Azeez Mustapha